Your SGB Real Estate Market Summary
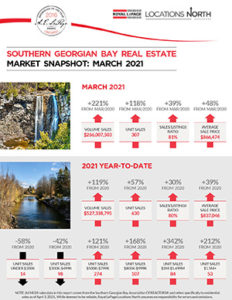
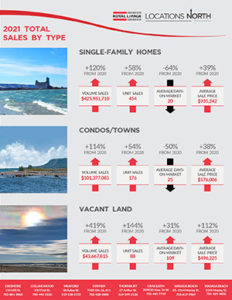
Southern Georgian Bay records a Q1 Sales Volume of $527,338,795, up 119% from Q1’s 2020 Sales of $240,858,636. The demand for listings continues to be far greater than the supply, fueling a strong Sellers Market. How low are the inventory levels? We currently have only one months worth of inventory. Not only do Buyers have fewer homes to choose from, but listings are spending only 18 days on market compared to 28 days in March 2020. A pent up buyer demand results in Multiple Offer situations in all sectors, driving the average sale price up to $837,046, up 39% from just one year ago. The Average Listing is receiving 103.7% of List Price, further illustrating the buyer’s need for housing.
Market Impact On Buyers & Sellers
What does this mean for you? Whether you are buying or selling, it is now more important than ever to have proper representation. You need a local Realtor who knows the Market and has proven strategies in place to ensure you are successful in achieving your Real Estate Goals.
Text, Call, Email – I’m here to explain how the Market will affect your unique situation and how I can help you.
Looking for Market Statistics on one of our specific Communities? Check out Quarterly Updates here.


