Volume Sales DOWN, Unit Sales DOWN, Sales/Listing Ratio DOWN
BUT...
AVERAGE SALE PRICE UP!!!!!!!
Reviewing the numbers from Q1, it all makes sense. Even with all of the “noise” happening in the market, it has not cooled our Average Sale Price – maybe the opposite?
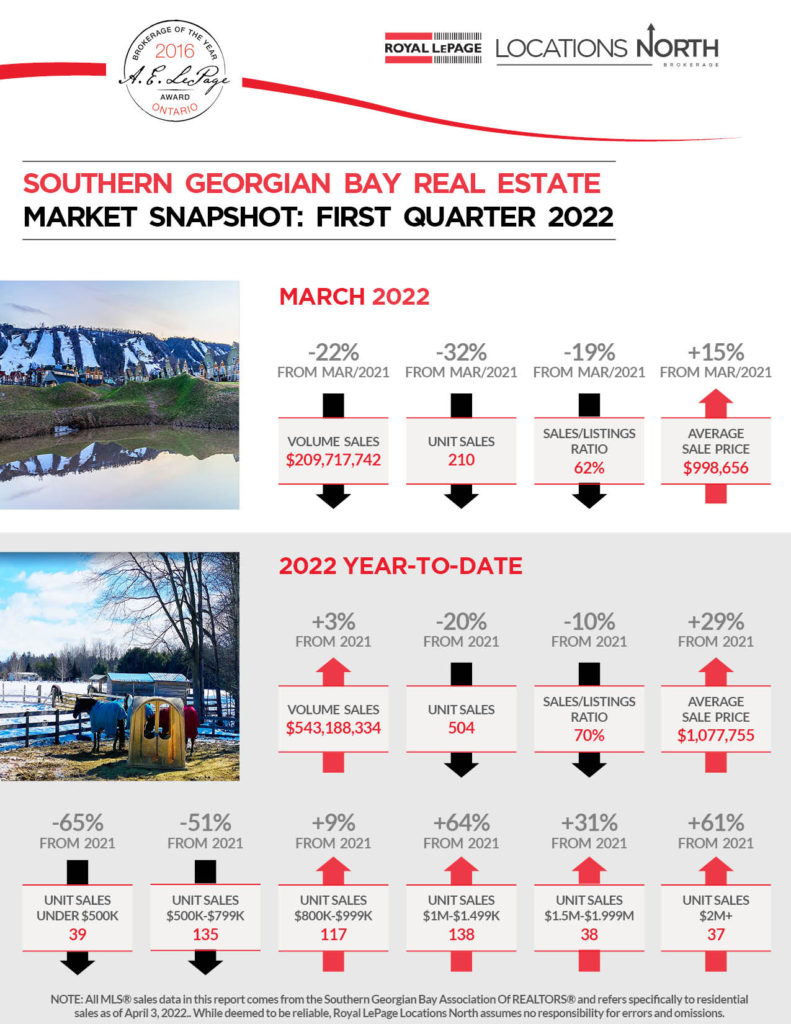
Volume Sales is down 22% from March 2021. Unit Sales plummeted further from February’s 18% drop to 32% compared to March 2021.
This results in more buyers crowding into the already limited space and could continue to drive the price up!
The Impact On Your Home
So we are finally seeing some negative percentages, which is new since the rollercoaster Covid has put RE on. Unfortunately for many buyers, all these numbers mean are less houses on the market and prices still increasing.
MARCH 2022
Unit Sales ⬇️ 32% from 2021
Sales/Listing Ratio ⬇️ 19%
Average Sale Price ⬆️ 15% to $998,656 from 2021
The Shake Down For Each Sector - 2022 Year To Date
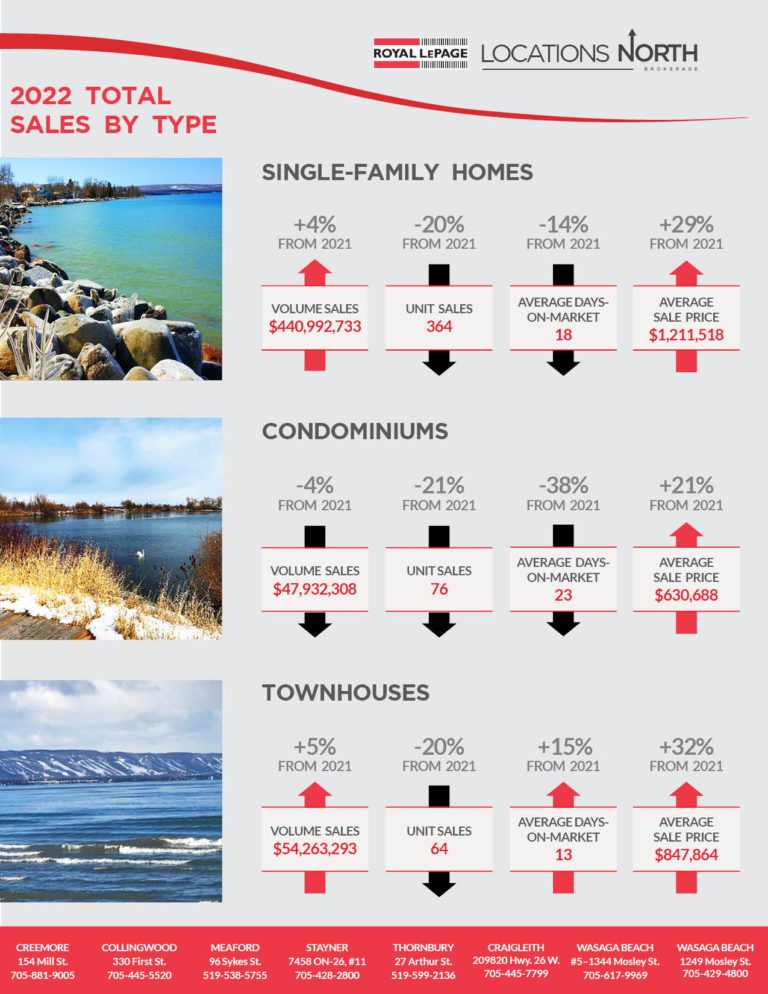
Single-Family Homes
Average Sale Price ⬆️ 29% to $1,211,518 from 2021
18 Average Days On Market ⬇️ 14% from 2021
Sales Volume ⬆️ 4%
Condominiums
Average Sale Price ⬆️ 21% to $630,688 from 2021
23 Average Days On Market ⬇️ 38% from 2021
Sales Volume ⬇️ 4%
Townhouses
Averages Sale Price ⬆️ 32% to $847,864 from 2021
13 Average Days On Market ⬆️ 15% from 2021
Sales Volume ⬆️ 5%
What Does This Mean?
Number of listings and therefore sales were down substantially in March. Year To Date totals are still in the positive when compared to March in 2021 due to the very strong January and February we experienced. Average Sale Prices continue to go up in every sector.
Download Southern Georgian Bay Market Snapshot - Q1
Have Questions?
Text, Call, Email – I’m here to explain how the Market will affect your unique situation and how I can help you.

